You're making talent decisions in the dark — and it's costing your company every month.
MyDNA People Analytics centralizes data across your entire organization and turns it into early warnings, turnover predictions, and evidence-backed decisions — not gut feeling.
No commitment. Response within 24 hours.
at risk of leaving — Sales
The problem
Every week without visibility is a decision made in the dark.
Talent is your company's biggest asset — and the hardest to manage without data. This is what most HR teams in LATAM face today.
Decisions without real data
Your team spends hours consolidating HR data manually into spreadsheets — only to produce a report that's already outdated by the time it reaches your desk.
No early warning system
You find out a key talent is leaving when they've already handed in their notice. By then, the cost has already been incurred — and keeping them is nearly impossible.
Can't prove HR's ROI
When the board asks for evidence of the impact of your HR initiatives, you don't have numbers. Investment decisions about people are made on instinct, not analysis.
Partial visibility, always
Your data lives in five different systems that don't talk to each other. The real picture of your organization never appears complete on any screen.
There's a better way. And it's available for your company today →
See flow, potential, and criticality. One single panel.
We connect all your HR systems, apply AI models trained on LATAM talent data, and deliver the full picture of your organization — updated in real time, with actionable alerts and market context.
Four steps: from data to decision.
Centralization
We connect all your HR systems — HRIS, payroll, surveys, assessments — into a single source of truth. No more spreadsheet exports or manual consolidation.
Automatic analysis
Our AI models process the data and detect invisible patterns: teams with high turnover probability, managers with low engagement scores, eNPS trends.
Predictive alerts
You receive notifications before problems escalate. You know which talents are at risk, in which department, and how much time you have to act — before they leave.
Evidence-backed decisions
You bring real data to the executive committee. You justify investments, prove the ROI of initiatives, and make talent decisions with the same rigor as the finance team.
The modules
Seven modules. A complete view of your organization.
From the executive dashboard to each employee's individual profile — all connected in a single platform.
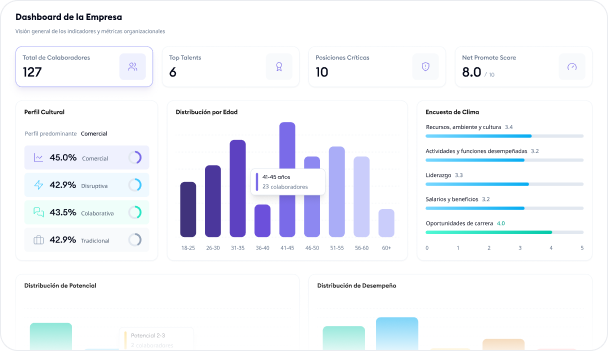
Company Dashboard
Consolidated panel with the organization's strategic indicators: total employees, Top Talents, Critical Positions, and published news. Distribution visualizations by gender, age, area, hierarchical level, potential, and performance. Includes predominant cultural profile and climate results by dimension.
My Employees
Team management view for leaders and HR: list of employees with key indicators, evaluation status, feedback history, and 1:1 meetings. Direct access to each person's individual Mandala from the same screen.
Employee Mandala
Individual 360° profile that centralizes everything about a person: professional history, purpose, education, culture (Commercial / Traditional / Disruptive / Collaborative), salary, competencies, motivations, performance and potential, training, career plan, MyDNA analysis, digital profile, and personal data.
Global Search
Search engine to find any employee in the organization by name, area, role, competencies, or cultural profile. Immediate access to the Mandala from search results.
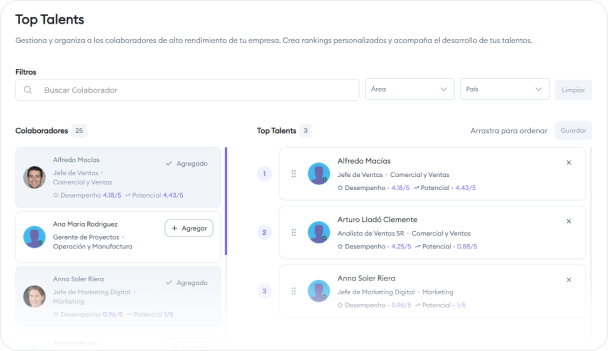
Top Talents
Screen for HR to build and rank the company's top talent list. Employee cards are draggable — HR manually reorders to define the final list and can save the order with one click.
Critical Positions
Centralizes employees whose position, function, or potential is critical to the business — regardless of whether they are top performers. Two parallel lists: HR drags employees from one to the other to organize the criticality ranking.
Employee Campaign
Tool for mass platform access deployment. Launch activation campaigns, send invitations to employee groups, and track each person's access status.
Modules in detail
Three modules that change how you manage talent.
Company Dashboard
The starting point for any People Analytics session. An executive panel consolidating the organization's most critical indicators: headcount, identified Top Talents, active Critical Positions, and visual distributions of potential, performance, gender, age, and organizational structure.
- ✓Header KPIs: employees, Top Talents, Critical Positions
- ✓Distribution by gender, age, area, and hierarchical level
- ✓Organizational potential and performance at a glance
- ✓Predominant cultural profile and climate results by dimension
Employee Mandala
The most complete 360° profile on the market. A hub centralizing everything that matters about a person: professional history, purpose, education, culture, competencies, salary, motivations, evaluations, training, career plan, MyDNA analysis, digital profile, and personal data.
- ✓Culture in 4 categories: Commercial, Traditional, Disruptive, Collaborative
- ✓Performance and Potential with evaluation scores and 9-Box position
- ✓Enrolled and completed training linked to the profile
- ✓Career Plan with recommendations from employee, algorithm, and HR
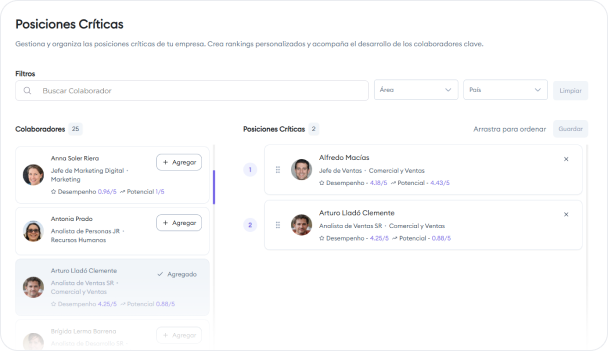
Top Talents & Critical Positions
Two strategic lists HR builds deliberately and manually. Top Talents is the ranking of the organization's best performers. Critical Positions identifies roles whose function is indispensable to the business — regardless of performance level. Both are built by dragging cards and saving the order.
- ✓Draggable employee cards to build the ranking
- ✓Top Talents: focus on best performers
- ✓Critical Positions: focus on business criticality
- ✓Saved order available for the talent committee
Operational intelligence
From the executive dashboard to each employee's detail.
People Analytics does not stop at a chart. It connects the company view with concrete actions on people, roles, rankings, and access activation.
Company Dashboard
A consolidated panel so HR can see organizational health without opening five different reports.
- ✓Distribution by gender, age, area, and hierarchical level
- ✓Potential and performance distribution
- ✓Company's predominant cultural profile
- ✓Consolidated climate results by dimension
My Employees
The operational list of the full workforce, with filters by country, area, and hierarchical level plus direct actions on each profile.
Global Search
Columns are configurable so each talent committee can compare exactly the variables it needs.
Rankings and activation
Information ends in an HR action.
The module lets HR prioritize talent, protect critical positions, and activate employees in the platform from the same workflow.
Top Talents
HR builds a ranked list of high-performance, high-potential employees. Cards are draggable, the order is adjusted manually, and the list is saved for follow-up.
Critical Positions
Two side-by-side lists help move employees into the critical positions ranking. The focus is role criticality, not only individual performance.
Employee Campaign
HR sends emails and grants MyDNA Colabs access to selected groups, accelerating evaluation cycles, surveys, onboarding, or platform adoption.
System layers
Five layers of people intelligence.
Each layer answers a critical question you're currently answering without data — or not answering at all.
Turnover Risk
Real-time turnover risk index by team and department. Identify who's at risk of leaving before they decide to go.
Engagement Heatmap
Visualize commitment levels by manager, team, and area. Instantly detect which leaders are disengaging their teams — and act before it hits results.
Dynamic eNPS
Employee Net Promoter Score evolution with automatic cause analysis. Understand what drives or damages your employees' experience with qualitative and quantitative evidence.
Turnover Cost & ROI
Real-cost projection of each departure — hiring, onboarding, productivity ramp. Calculate the ROI of your retention initiatives with concrete numbers for the board.
Market Benchmarking
Compare your engagement, turnover, and satisfaction indicators against your industry and country averages. Know exactly where your company stands in the employer ranking.
More analysis. More decisions.
Less turnover.
employees with analyzed data on the platform
average turnover reduction in the first 12 months
to the first strategic decision backed by data
active companies across 10 LATAM countries
Built for those who make people decisions with data and under pressure.
This isn't a reporting tool. It's the operating system for HR teams that have decided to stop improvising.
Before: Needs to justify the HR budget to the board with data, but has no concrete impact numbers.
With MyDNA: Brings projected turnover costs, initiative ROI, and risk index by area to every executive meeting.
Before: Makes decisions about hundreds of people with partial, delayed, and market-free information.
With MyDNA: Has the full organizational picture updated in real time, plus sector benchmarking for every indicator.
Before: Spends hours consolidating data from multiple systems to prepare reports that always arrive late.
With MyDNA: Automatic reports, proactive alerts, and more time for strategic work — instead of spreadsheet management.
FAQ
What people ask before deciding to use data.
Does MyDNA People Analytics integrate with our current HR system?
⌄
Yes. MyDNA integrates via API with the leading HCM systems: SAP SuccessFactors, Workday, ADP, BambooHR, and others. In most cases, MyDNA complements your existing system by adding the analytics and intelligence layer these systems lack natively.
How long does implementation take?
⌄
Between 4 and 8 weeks with full specialist support. The first dashboard with your company's real data is typically available in week 2. No internal technical team required — our specialists handle all integrations.
Is our company data safe and confidential?
⌄
Completely. We comply with LGPD (Brazil), Chile's Law 19.628, and the data protection regulations of each country where we operate. Your data is never shared with other clients or used to train third-party models. Your information is 100% yours.
Do we need a technical or data team to use the platform?
⌄
No. MyDNA is designed to be used directly by HR teams without technical knowledge. Onboarding includes training for all users, and we have HR specialists available to interpret data with you at every stage.
Can we see real data before deciding to sign?
⌄
Yes. In the demo we show dashboards with real data from companies in your industry and size range — not mockups or fictional data. In 30 minutes you can see exactly how your organization would look inside the platform.
How do we justify the cost to the board?
⌄
People Analytics ROI is calculated based on avoided turnover costs. In companies of 200–500 people, a 30% reduction in turnover represents annual savings of $150K–$400K USD. We help you build that calculation using your company's data before you sign.
What data appears in the Employee Mandala?
⌄
The Mandala centralizes professional history, purpose, education, culture, salary, competencies, motivations, performance and potential, training, career plan, MyDNA analysis, digital profile, and personal data. It is the reference screen for understanding each person with full context.
What is the difference between Top Talents and Critical Positions?
⌄
Top Talents ranks employees with the strongest performance and potential. Critical Positions identifies people or roles that are indispensable to business continuity, even when the person is not listed as a top performer.
Can global search filter by performance, potential, and salary?
⌄
Yes. Global search can filter by age, country, area, level, seniority, tenure, performance, potential, 9-Box profile, salary, and salary versus market. Table columns can also be configured for the analysis.
How does HR activate employees in the platform?
⌄
With Employee Campaign, HR can send emails and grant MyDNA Colabs access to selected employees in bulk. It is useful for launching evaluation cycles, surveys, onboarding, or adoption of new modules.
Have more questions? Contact us →
See in 30 minutes exactly where you're losing critical talent today.
We show real data from companies like yours — not generic presentations. In 30 minutes you'll know what turnover is costing you and what you'd do differently with People Analytics.